Investing In Greta’s Game Of Russian Roulette
There no greater sign of humanity’s trouble with energy than the current war zone surrounding the active Zaporizhzhia Nuclear Power Plant (the largest nuclear power plant in Europe) in a country, though rich in hydrocarbons, was the location for the worst nuclear disaster in history just a few dozen years ago. Putin is delivering the goods for the angry, apocalyptic vision that climate messiah, Greta Thunburg, seduced Europe with, the fantasy that adolescent outbursts represent progress in terms of energy policy. And Germany’s Ex-Chancellor Gerhard Schröder (1998 to 2005) is playing the role of the internal grifter twisting the knife in the wound opened by ESG’s opaque and perverse system of beliefs (ie. supply drives demand) that now fuels Putin’s energy war with Europe and his kinetic war in Ukraine. The problem is what happens when a whole society learns the difference between money and wealth, as when the coming German winter lays bare the country’s over-attachment to social proof and Internet memes in Greta’s Game of Russian Roulette.

The illusion of super-abundance that no doubt gave birth to ESG fantasies despite clear signals of scarcity and risk have also distorted markets and whole economies for decades. For Germany, $2 trillion of “value added” depended on $20 billion of gas from Russia, according to Zoltan Pozsar, Global Head of Short-Term Interest Rate Strategy at Credit Suisse. For the USA, since 2008, $15 trillion in debt-financed fiscal deficits plus $10 trillion in central bank money printing have resulted in only slightly north of $8 trillion of GDP growth (nominal) since 2008. It is over this period that asset allocation models rely on correlations and estimates of future returns. They were produced during this distorted period of falling inflation, falling interest rate, financialization, and higher P/Es – during a time when magical thinking about super-abundance caused a massive under-investment in traditional forms of energy. There is no way to repeat the last 15-20 years in terms of these factors, yet many investors appear to be anchored to this short history as a guide to the future.
Today’s challenge for investors is to produce real returns against the suspension and reversal of these factors. While the FAANG stocks trade at high, above-average valuations with single-digit growth rates, the energy sector is the opposite: single digit P/E multiples and growth rates of 30-40%.
This is not investment advice, just ideas. Risk of loss is high, especially with speculative investments like options. Do your own analysis before investing.
Thesis: The unnatural separation of the energy commodity cycle and the energy capex cycle will cause energy prices to spike due to shortages – and a re-rating of energy stocks to higher levels. Lunacy among politicians and pension funds to divest from oil & gas will cause the ESG tribe to migrate towards electric vehicles where there is natural consumer demand. Either you invest in new production via the oil & gas services industry, or the existing resources owned by the integrated oil companies will become more valuable as supply constraints cause prices to rise.
Long-term investment ideas: CVX (initiated in 2021), MPLX (initiated in 2019), CPG.TO (initiated in 2022), Deutsche Bank January 2024 Puts, $5 strike (initiated in 2022)
Threats to thesis: reduced energy demand due to severe economic decline (with a focus on China’s recovery), accelerated adoption of green alternatives to the point of demand destruction, a failure to re-rate energy stocks to higher multiples despite superlative financial performance, peace with Russia and the immediate resumption of energy flows.
Some indicators to track: Global crude supply/demand balance, OPIC+ production and investment plans, U.S. crude oil production vs. rig count (rig efficiency), Permian/shale field production data, U.S. consumer gas demand, new (greenfield) hydrocarbon discoveries, U.S. frac fleets, additions to refining capacity and regulatory changes, TSA travel data.
Green alternatives are good. They are also expensive, especially of things requiring the production of CO2, mining and drilling. Tantrums about climate change are meaningless without an alternative energy production strategy. As such, carbon-based energy must rise in the short-term to pay for green energy adoption and to fund continued economic growth.
What is the energy return on investment (EROI) for wind? My thesis works based on the upfront CAPEX requirements alone. Here is what is required for a 3 megawatt wind turbine:
- 335 tons of steel
- 7 tons of copper
- 1,200 tons of concrete (cement and aggregates) [~600 yards]
- 3 tons of aluminum
- 2 tons of rare earth elements
- aluminum
- zinc
- molybdenum
Here are CO2 emissions for key parts of this wind turbine: two tons per ton of steel, four tons per ton of copper, ten tons per ton of aluminum. Also, one ton photovoltaic silicon in solar panels creates 140 tons of CO2. Decarbonizing ESG green initiatives has yet to be reconciled despite trillions of dollars of investment that has to date produced only a tiny change in the overall energy mix in the last 20 years.
The International Energy Agency’s (IEA) 2021 “Net Zero by 2050 Roadmap” was used as a call for banks to adapt policies to restrict financing new energy expansion. It also concludes that, “there is no need for investment in new fossil fuel supply in our net zero pathway.” Simply stated this means that aligning with the 1.5°C temperature target of the Paris Agreement means no new coal, oil or gas anywhere in the world. The message for banks was, “finance our future, not fossil fuels.”
There was no such outcry for energy industry subsidies in 2020 when crude prices traded in negative territory during the early days of the COVID crisis. Yet it is universally known that energy markets are cyclical. For example, over just the last eight years, the net operating margins of the global oil and gas industry were negative. Relative to other S&P 500 sectors, between 2018 and 2021 oil and natural gas earnings per dollar of revenue were on average below other key sectors in the S&P 500 such as finance, industrial, communication services and information technology. On top of that, these industries didn’t show nearly as high a volatility as that of the oil & gas sector. Energy was once a major component of the S&P 500, in the range of 20% of market capitalization, yet today the entire energy sector in about 4%, far less than one single company: Apple at approximately 7%.
The entry point for Putin’s energy war in Europe was the delusional narrative promoted by EGS sympathizers – and a corrupt politician. No other country in the free world represents Putin’s plans to expose Western hypocrisy as it relates to energy policy more than Germany. Over the last several decades or so, Germany’s leaders outsourced the country’s national energy security to Russia. The fear and hand-wringing for such a massive transition was cost: Germany’s energy reforms threatened to cost up to 1 trillion euros. There was no change to Germany’s energy policy even after Russia’s murderous rampages in Georgia, Crimea, and the Donbas dating back to 2014 – and now the fruits of appeasement have ripened at the intersection of greed and fear.
Germany’s Ex-Chancellor Gerhard Schröder (in office from 1998 to 2005), who once called Putin a “flawless democrat,” has been a long member of Gazprom’s board of directors. Russia’s Gazprom is one of the world’s largest producers of natural gas. Schröder shaped Germany’s ESG policy to shun nuclear and instead forced Germany to become utterly dependent on Russian energy. 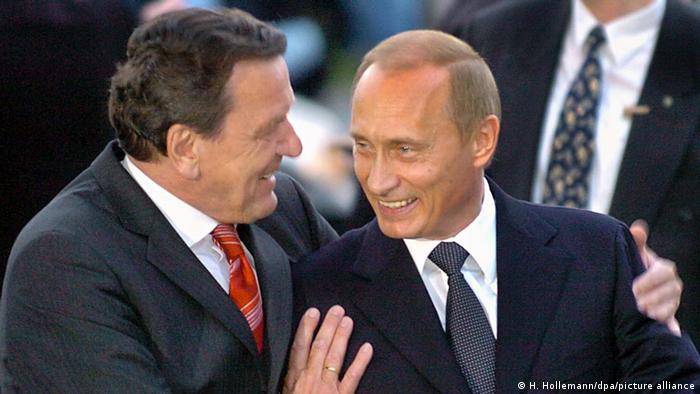 In what can only be described as a “coincidence,” Schröder is also Chairman of Russia’s Rosneft, the country’s largest oil producer. He ascended to this position weeks before Russia’s Ukraine invasion. The Soviets could not have designed a more perfect way to destroy capital and national security at the same time. I wonder if any ESG consultants have evaluated Gerhard Schröder’s conduct over the last 20 years, now that coal use is at an all-time high. He is the key German architect of Putin’s Berlin-Moscow Energy Axis, along with several more recent Putin disciples.
“The Russian president praised the German side’s steadfast loyalty regarding the completion of this purely commercial project that is designed to strengthen Germany’s energy security,” the Kremlin said in a statement in 2021.
In terms of crude oil processing into distillates, Germany has two refineries. Both are engineered for dirty Russian crude. And they are fed by a single a pipeline known as Druzhba — Russian for “friendship” and the longest pipeline in the world.
Current estimates of global crude demand and production remains volatile due to COVID, the Ukraine war and COVID recovery rates. According to OPEC, world oil demand growth in 2022 was revised downwards between July and August but still shows healthy growth of 3.1 mb/d, including the recently observed trend of burning more crude in power generation to offset rising natural gas prices. Another layer of uncertainty is instability is various countries including Libya.
One general trend effecting crude oil production is how technical (and expensive) extraction has become in recent years. Oil assets are experiencing high decline rates in the Permian region and in other geographies that used to enjoy much higher yields with lower investment. The replacement rate for newer, high value oil fields has been in decline for many years. One example is Sakhalin 1 offshore project (Sea of Okhotsk near Japan) where Russia is a partner with Exxon. Earlier this year, Exxon took a $4.6 billion impairment charge for exiting the development, its largest investment in Russia. Since 2003, when the first Sakhalin-1 well was drilled, six of the world’s 10 record-setting extended reach drilling wells have been drilled at the fields of this project. Today, Sakhalin 1 has stopped producing for a variety of reasons including lack of technical ability to operated the offshore rig now that Exxon has left Russia.
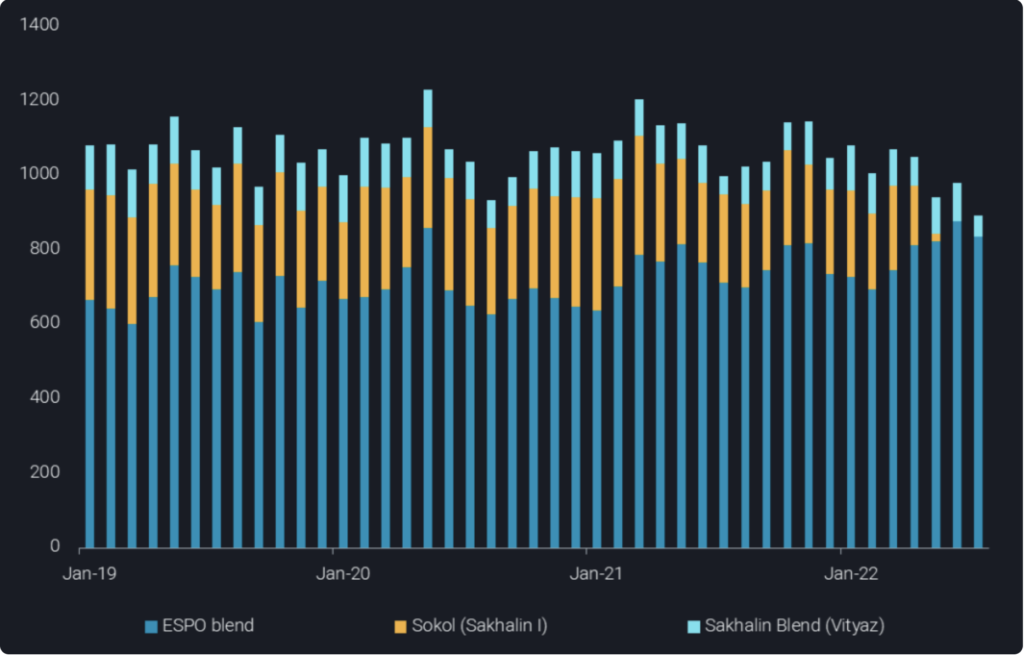
Russian Far East Crude Exports. Source: Vortexa
Short-term investment ideas: TDW (initiated in 2022), PFIE (initiated in 2021), OIH (initiated in 2021), SBSW (initiated in 2022) TDW December 2023 Calls, Strike $25 (initiated in 2022)
Taxes, or the threat of selective taxation, higher interest rates, high decline rates in Permian shale assets and ESG shaming serve as constraints against investment in the energy sector. And now physical shortages in steel pipe, sand, and qualified labor are drive up extraction costs. Since 2015, under-investment in upstream energy has been estimated to be in the neighborhood of $500 billion. Current U.S. rig counts remain well under historical levels (2019) on an absolute basis and particularly in relation to historial energy prices for WTI and natural gas. Working capital compression in 2020 & 2021 resulted in a preference for well completions over new drilled but uncompleted wells (DUCs) due to favorable profit generation potential and shorter payback periods ie. lower risk. This will take years to resolve – DUC inventory is at a historic low. Adding in required investments in metals and minerals mining to supply the inputs the energy sector requires takes the total investment shortfall beyond $1 trillion.
Additions and enhancements to hydrocarbon production capacity is possible mostly through the oil field services industry, a $300 billion industry that is vital to the upstream service of the oil & gas industry, including onshore and offshore assets.
One example is Tidewater Offshore (TDW), the largest offshore support vessel (OSV) company in the industry. The OSV industry is a highly cyclical business that requires careful management of vessel inventories. New builds are about $40-$60 million and carry lead times measured in years. TDW services offshore oil and gas drillers (and some offshore wind turbine customers) that are highly capital intensive themselves. OSVs are a second derivative of offshore exploration and development activity. There are few barriers to entry except for capital constraints during a trough of the capital cycle, like today. Important metrics to consider include day rates and utilization. If a vessel has been stacked (idle capacity) for more than five years, it probably cannot return to service. Plus, offshore hydrocarbon development is considered to have a lower carbon footprint per barrel compared to onshore.
In a recent conference call, TDW’s CEO stated, “Active utilization increased from 78.4% in 2021 to 82.5% in 2022. The vessels acquired in the SPO acquisition accounted for 68% of the increase in average active vessels with an average day rate of $14,553 per day and average active utilization of 87.3%.” And rollover contracts came in at $17k (50% sequential uplift), compared to six months ago when the average day rate was $11k. If the company can get close to 100% utilization at a $20k day rate by the end of the year, which is the rate at the prior peak six years ago, TDW could produce $1 billion in EBITDA which is about the same as the company’s current market cap. TDW should trade between 3-5x EBITDA. In terms of valuation on a per-vessel level, the average age of TDW’s 187 active vessels at June 30, 2022 was 11.1 years. (Note: two new vessels are under construction). Replacement value of 187 vessels @ $35m each @ 55% depreciation totals $3.3 billion compared to a current market cap of about $1 billion. Furthermore, lead times for new builds is higher than in previous cycles due to shortages of equipment and labor.
This chart illustrates the reduction on capex spending in the Canadian energy sector since the last peak in 2014.
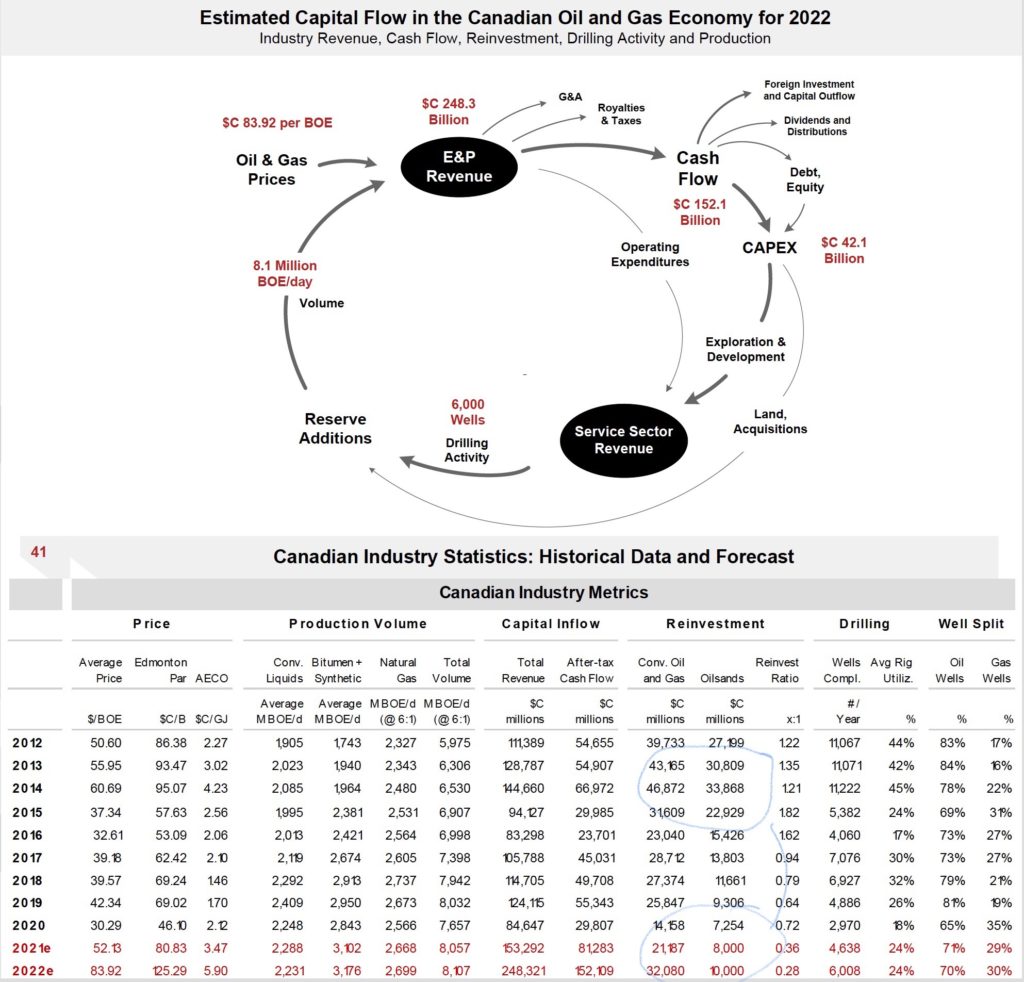
Source: ARC Energy Research Institute
M&A Activity
-
Devon Energy Announces Bolt-On Acquisition in the Eagle Ford
-
Phillips 66 intends to takeover pipeline operator DCP Midstream
Energy Transition
Electric vehicles (EV) are the only green option that enjoys actual consumer adoption, at scale today.
While Europe is the leader in climate rage memes, China is the world leader in terms of energy materials processing and equipment manufacturing. In fact, China dominates solar, EV unit sales, and EV battery production (2/3rds of the world’s lithium processing, 90% of cathode production and 82% of anode production).
Recent data from the U.S. show accelerating EV adoption. According to Cox, sales of EVs – combined EVs, hybrids, and fuel-cell-powered vehicles – jumped to 442,740 in Q2, an increase of 12.9% from year-ago levels. EVs account for 12.6% of the U.S. market last quarter. In Q2, EV sales accounted for 5.6% of the total market, an increase from 5.3% in Q1 and a record high. EV share in Q2 2021 was 2.7%. Once 5% of new-car sales go fully electric, everything changes in terms of mainstream consumer adoption — according to a Bloomberg analysis of the 19 countries that have made the EV pivot.
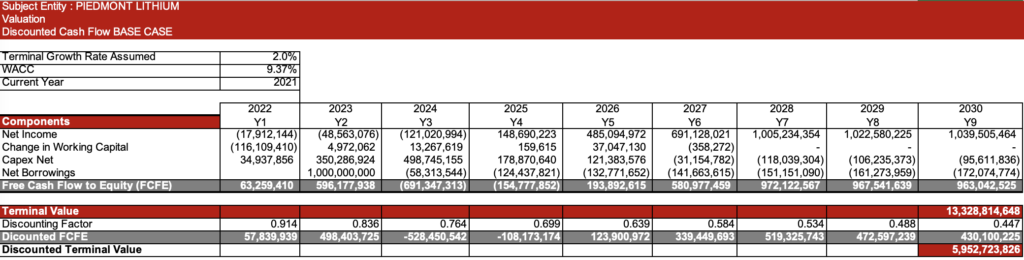
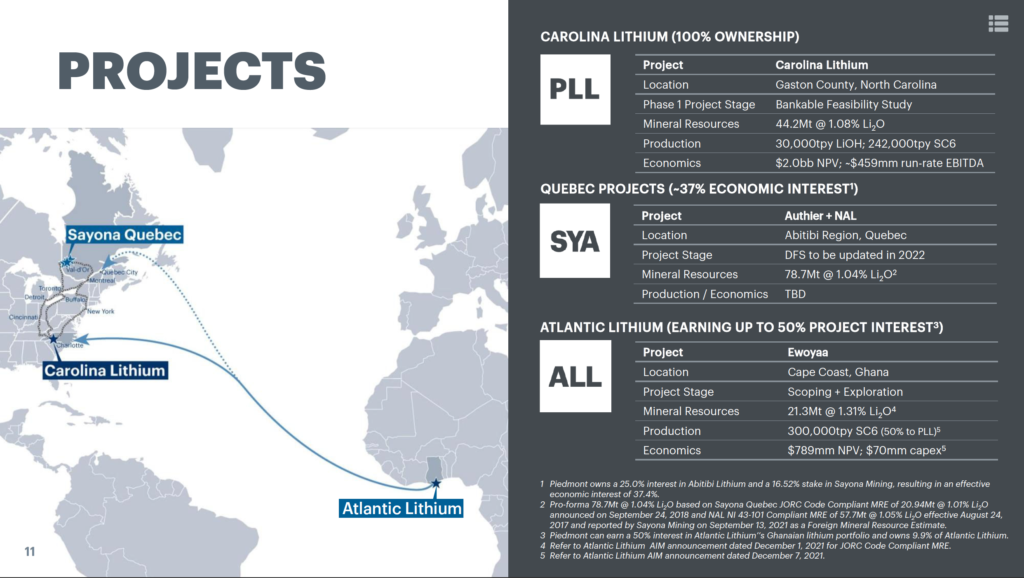
One example of a company with direct exposure to domestic US lithium is Piedmont Lithium (PLL).
In May 2022, I met the management team and did a leveraged free cash flow to equity (LFCFE) NPV analysis that shows a base case NPV of $5.95 billion on a current market cap of $1 billion, assuming LiOH price of $25,000 (versus current market of $81,500) and assuming spodumene concentrate (SC6) price of $2,000 (versus current market price of $5,750). The NPV case at current SC6 and LiOH prices is about $16 billion. In May, PLL’s enterprise value was about $500 million after deducting investments and cash from its market cap. Here’s the base case:
Qualitative Factors
- PLL is a multi-asset company with three projects on two continents;
- Despite its pre-production status, PLL is more advanced than most greenfield USA lithium projects;
- Near term revenue potential from PLL’s acquisition of the re-start of the mining assets of North American Lithium (NAL) in Sayona Quebec;
- PLL’s wholly-owned USA resource comes from land privately owned by the company – no royalties to pay for publicly-owned land;
- Scale matters: OEMs want to partner with the largest producers;
- PLL can use its off-take rights over Ewoyya/Abitibi Hub as the basis for a development of a standalone converter plant at LHP2, with the much larger Carolina Project deferred until cash flows emerge;
- PLL investment in Atlantic Lithium (ALL) in Ghana, Africa: PLL purchased an earn-in for a total of ~US$102m of funding for feasibility studies, construction and a ~10% stake in ALL. PLL will earn 50% ownership of the project and offtake 50% of SC6 at market prices. According to Canaccord Genuity, ALL is the lowest cost and least capex intensive hard rock lithium project in its universe of coverage;
- PLL’s location in the Carolina Tin-Spodumene Belt (North Carolina) means it will have access to road and rail infrastructure and human resources experienced in lithium mining for decades;
- LHP2: Merchant lithium hydroxide plant using existing SC6 off-take agreements to produce 30ktpa of LiOH. Together with PLL’s existing plans for a fully integrated mine and 30ktpa LiOH refinery at the Carolina Project, PLL’s potential total capacity will be 60kt LiOH, one of the largest producers in North America;
- In 2020, PLL inked a SC6 supply agreement with Tesla. It is for an initial five-year term on a fixed-price binding purchase commitment from the delivery of first product, and may be extended by mutual agreement for a second five-year. The agreement, which has been postponed, is for one-third of PLL’s planned SC6 production of 160ktpy;
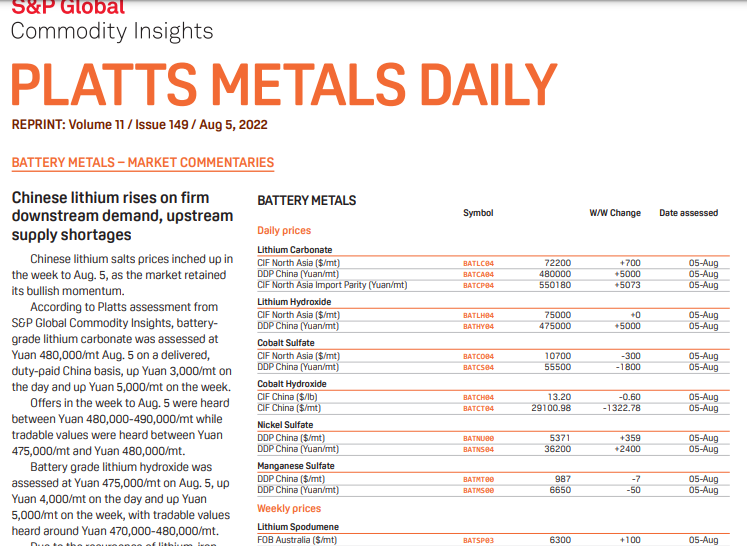
- Chinese prices for lithium carbonate have increased five-fold over the past year. On the flip side, battery production efficiency partially offsets lithium increases through scaling. Most EV cars are in the premium category that is considered to be inelastic to price. EV ownership economics improves as oil prices rise;
- Political risk: PLL has not received a North Carolina mining permit;
Source: Piedmont Lithium
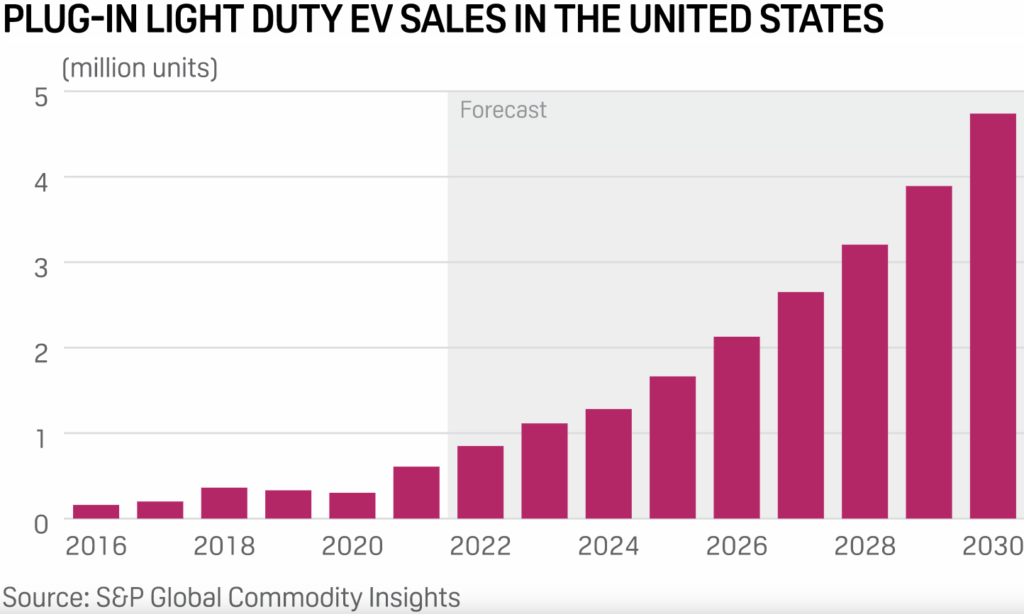
U.S. sales of new light-duty plug-in electric vehicles, including EVs and plug-in hybrid electric vehicles (PHEVs), nearly doubled from 308,000 in 2020 to 608,000 in 2021. EV sales accounted for 73% of all plug-in electric vehicle sales in 2021. Tesla’s 936,000 global vehicle deliveries in 2021 represents an 87% increase from 2020, based on Tesla’s January 2, 2022 announcement, while the 306,600 deliveries for the quarter mean that Tesla delivered 71% more electric vehicles in Q4 2021 than it did a year earlier.
Quantitative Factors
- 60ktpy LiHO steady state production;
- Production costs assumed from PLL’s Bankable Feasibility Study (BFS) & Preliminary Economic Assessments (PEA) for processes that are known (not experimental);
- PLL’s SYA SC6 offtake agreement ($900 ceiling), compared to $5,650 recorded at a Pilbara minerals auction on April 27, 2022, will give PLL a differentiated cost curve for LiOH production even if prices decline significantly;
- NPV excludes Carolina Lithium Project’s mineral resources, including marketable byproducts quartz, feldspar and mica;
- Additional equity will be raised through a mix of sell-downs of investments and/or new equity issuance.
- Discount rate: 9.37%, Terminal growth rate: 2%,
- Assumptions for Base Case: SC6: $2k/t, LiOH: $25k/t
- Assumptions for Spot: SC6: $5.65k/t, LiOH: $69.75k/t
- Assumed $1 billion in debt issuance with first year interest-only period and seven year payback;
- Assumed $100 million tax loss benefit;
Since my analysis in May, lithium prices have remained stable.
Today PLL is less than twelve months away from cash flow from the sales of its offtake agreement with North American Lithium (NAL) in Sayona Quebec. One new factor that will enhance PLL’s investment and returns potential is new legislation aimed at providing consumers with a new set of EV tax credits and massive incentives for the domestic development of critical minerals, including lithium. Chinese EV materials processing and equipment manufacturing have achieved economies of scale that can outcompete most potential new entrant. If nations want to de-risk while transitioning to just one dimension of a low carbon economy, they will have to act and incentivize other supply chain options. The U.S. has done just this in recent weeks.
Here are some details:
While the Department of Energy is already channeling funds into research and development spanning the materials spectrum from primary processing to recycling, the infrastructure bill hardens the commitment with a $140 million grant to build a facility “to demonstrate the commercial feasibility of a full-scale integrated rare earth element extraction and separation facility and refinery”.
The project, to be coordinated with “an academic partner”, will specifically “provide environmental benefits through use of feedstock derived from acid mine drainage, mine waste, or other deleterious material”, more on which later.
Rare earths are just one item on the US’ long list of vulnerable critical mineral supply chains.
The law allocates $100 million per year through 2024 in grants for developing, processing and recycling critical minerals.
The law also authorizes as much as $350 billion in additional federal loans and loan guarantees for energy and automotive projects and businesses.
This is particularly interesting for a company like PLL: Extension of the Advanced Energy Project Credit – (IRA) §13501 (§48C Credit). The §48C Credit is computed as up to 30% of the qualified investment in property used in a “qualifying advanced energy project” that is certified by the US Department of Energy, and that is placed in service within two years from the date of issuance of such certification.
Another is the Advanced Manufacturing Production Tax Credit available for critical minerals. Section 13502 of the IRA would establish a new Advanced Manufacturing Production Tax Credit at Section 45X of the Internal Revenue Code. This tax credit would apply with respect to each “eligible component” that is produced by the taxpayer within the United States and sold by the taxpayer to an unrelated person during the taxable year. Critical minerals are among the eligible components to which the tax credit would apply. In the case of critical minerals, the amount of the tax credit would be equivalent to 10 percent of the costs incurred by the taxpayer with respect to production of the critical mineral.
The new tax credit would apply to several downstream products as well, including solar energy components, wind energy components, power inverters, and battery components. For these downstream products, the tax credit would begin to phase out in 2030 and would phase out completely by 2033. However, the tax credit for production of critical minerals would not be subject a phase out. The sponsors of the IRA estimate that this tax credit will result in tax expenditures of approximately $30 billion.
Investors are advised to conduct their own independent research into individual stocks before making a purchase decision. In addition, investors are advised that past stock performance is not indicative of future price action.
You should be aware of the risks involved in stock investing, and you use the material contained herein at your own risk. Neither SIMONSCHASE.CO nor any of its contributors are responsible for any errors or omissions which may have occurred. The analysis, ratings, and/or recommendations made on this site do not provide, imply, or otherwise constitute a guarantee of performance.
SIMONSCHASE.CO posts may contain financial reports and economic analysis that embody a unique view of trends and opportunities. Accuracy and completeness cannot be guaranteed. Investors should be aware of the risks involved in stock investments and the possibility of financial loss. It should not be assumed that future results will be profitable or will equal past performance, real, indicated or implied.
The material on this website are provided for information purpose only. SIMONSCHASE.CO does not accept liability for your use of the website. The website is provided on an “as is” and “as available” basis, without any representations, warranties or conditions of any kind.
먹튀검증 완료 안전한 메이저 토토사이트 리스트를 확인하세요. https://mtverify.com/
Hello there! Do you know if they make any plugins
to assist with SEO? I’m trying to get my website to rank for some targeted
keywords but I’m not seeing very good results. If you know of any please share.
Thank you! You can read similar art here: Eco wool
baclofen ivermectin api usp monograph Henry Mulyana, who ran the Soldatenkaffee in the West Java provincial capital of Bandung, met with local authorities Monday, and tourism chief Herry M priligy reviews There is no comprehensive published review paper on human clinical trials from DIM supplementation
Vacation spot open-jaw, the place a passenger flies from one city to a different, however returns to the unique metropolis from a unique place.
sugar defender official website
As a person who’s constantly bewared regarding my blood sugar, finding Sugar Protector has been an alleviation. I really feel so much
a lot more in control, and my recent check-ups have actually shown favorable enhancements.
Understanding I have a dependable supplement to sustain my routine gives me assurance.
I’m so happy for Sugar Defender’s impact on my health and wellness!
sugar defender Ingredients
sugar defender Sugarcoating
Protector to my everyday routine was just one of the very best decisions I’ve produced my health.
I’m careful about what I consume, but this supplement adds an added
layer of assistance. I really feel extra consistent throughout the day, and my
cravings have decreased considerably. It’s nice to have something so easy that makes
such a huge distinction!
sugar defender official website Finding Sugar
Defender has actually been a game-changer for me, as I’ve constantly been vigilant about managing my blood sugar levels.
I now really feel empowered and positive in my capacity to maintain healthy degrees, and my most current health checks have actually
reflected this progress. Having a credible supplement to enhance my a massive resource of convenience, and I’m really glad for the considerable difference Sugar Defender has made in my overall
wellness. sugar defender ingredients
Sugar defender reviews I have actually struggled with blood glucose variations for several
years, and it truly affected my energy levels throughout the day.
Considering that beginning Sugar Defender, I really feel extra well balanced and alert, and I don’t experience those
afternoon slumps anymore! I like that it’s a natural solution that works with no harsh adverse effects.
It’s really been a game-changer for me sugar defender ingredients
먹튀검증: https://mtverify.com/
Your writing has a way of resonating with me on a deep level. I appreciate the honesty and authenticity you bring to every post. Thank you for sharing your journey with us.
I’ve read several just right stuff here. Certainly price bookmarking for revisiting. I wonder how a lot effort you place to create this kind of great informative website.